We’re more than just a design agency. With a wealth of experience in digital and print mediums, we take complex ideas to create content and visuals that are effortless to understand. For the organisations leading the way with technology, innovation and thought leadership, JDJ provides a splash of creative originality, that will amplify your reach.
We’re more than just a design agency. With a wealth of experience in digital and print mediums, we take complex ideas to create content and visuals that are effortless to understand. For the organisations leading the way with technology, innovation and thought leadership, JDJ provides a splash of creative originality, that will amplify your reach.
We’re more than just a design agency. With a wealth of experience in digital and print mediums, we take complex ideas to create content and visuals that are effortless to understand. For the organisations leading the way with technology, innovation and thought leadership, JDJ provides a splash of creative originality, that will amplify your reach.
We’re more than just a design agency. With a wealth of experience in digital and print mediums, we take complex ideas to create content and visuals that are effortless to understand. For the organisations leading the way with technology, innovation and thought leadership, JDJ provides a splash of creative originality, that will amplify your reach.
We’re more than just a design agency. With a wealth of experience in digital and print mediums, we take complex ideas to create content and visuals that are effortless to understand. For the organisations leading the way with technology, innovation and thought leadership, JDJ provides a splash of creative originality, that will amplify your reach.
We’re more than just a design agency. With a wealth of experience in digital and print mediums, we take complex ideas to create content and visuals that are effortless to understand. For the organisations leading the way with technology, innovation and thought leadership, JDJ provides a splash of creative originality, that will amplify your reach.
We’re more than just a design agency. With a wealth of experience in digital and print mediums, we take complex ideas to create content and visuals that are effortless to understand. For the organisations leading the way with technology, innovation and thought leadership, JDJ provides a splash of creative originality, that will amplify your reach.
We’re more than just a design agency. With a wealth of experience in digital and print mediums, we take complex ideas to create content and visuals that are effortless to understand. For the organisations leading the way with technology, innovation and thought leadership, JDJ provides a splash of creative originality, that will amplify your reach.
Proud to have worked with global companies for over 15 years
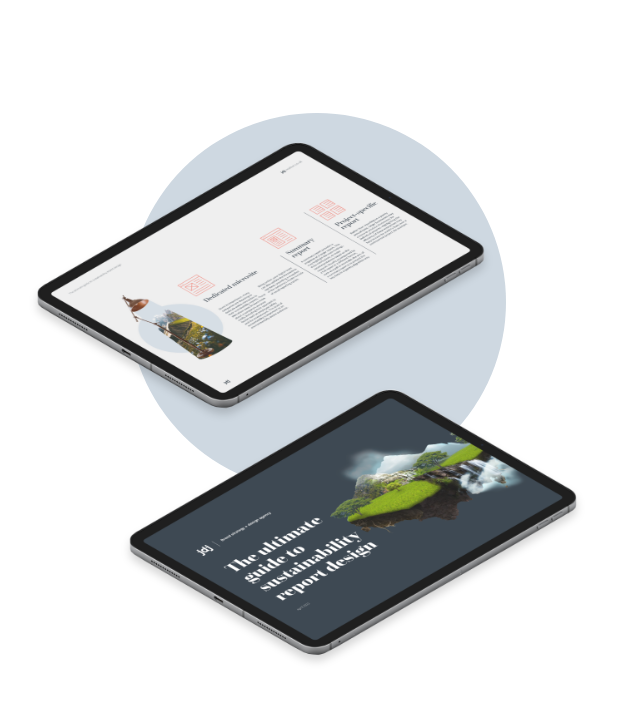
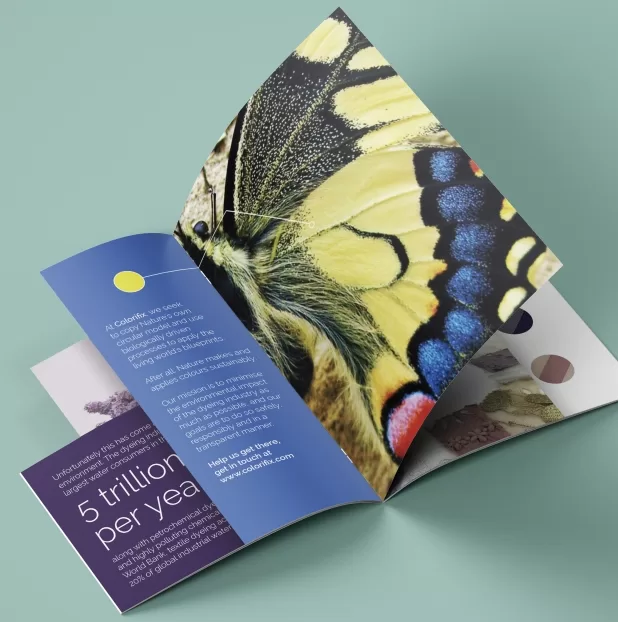
Sustainability report design
We’re more than just a design agency.
With a wealth of experience in digital and print mediums, we take complex ideas to create content and visuals that are effortless to understand. For the organisations leading the way with technology, innovation and thought leadership, JDJ provides a splash of creative originality, that will amplify your reach.
How we help brands with their data visualisation design
Dashboards // Infographics // Interactive Reports
At JDJ we take pride in our ability to make complex data accessible through UX design. Using your own data analysis and data science, we are experts at bringing data to life through cutting-edge technologies. If you want to display your data visually, in a way that revolutionises the information you’re communicating, please speak to our friendly team today.
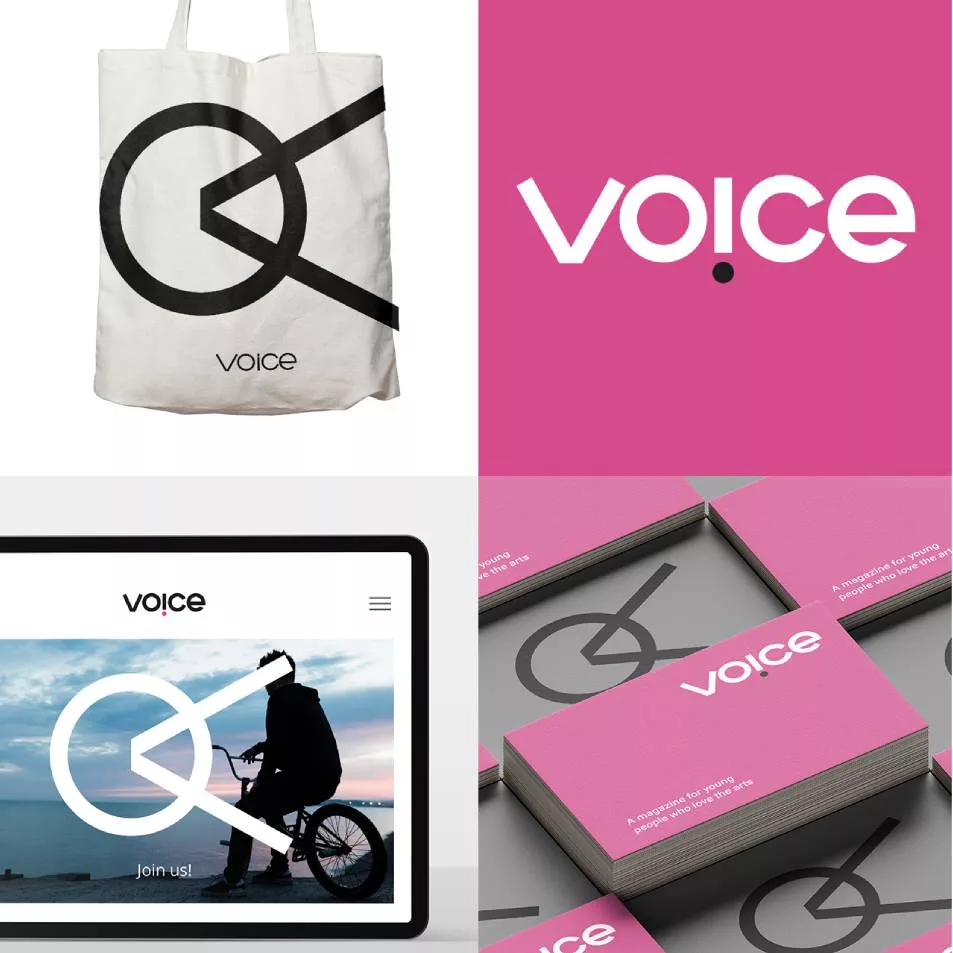
We work with organisations to create a brand strategy that quickly establishes trust with new customers while extending brand affinity with established stakeholders. Yet, our approach to brand is more than just visual. We help brands to form personalities; living compositions that tell stories, evoke emotions and connect with people. We help businesses to establish ‘why’ their organisation exists and align that purpose with clear brand messaging that resonates with their target audience.
Hide Bio Leather
We work with organisations to create a brand strategy that quickly establishes trust with new customers while extending brand affinity with established stakeholders. Yet, our approach to brand is more than just visual. We help brands to form personalities; living compositions that tell stories, evoke emotions and connect with people. We help businesses to establish ‘why’ their organisation exists and align that purpose with clear brand messaging that resonates with their target audience.
Frequently asked questions
If your question’s not answered here, please email us and we’ll get back to you.
Once you’re on the path to positive change, we’ll help you share your progress. Our content experts bring your stories to life through vivid language and design. They can shape messaging for different audiences, and make complex ideas, data and industry jargon easy to understand.
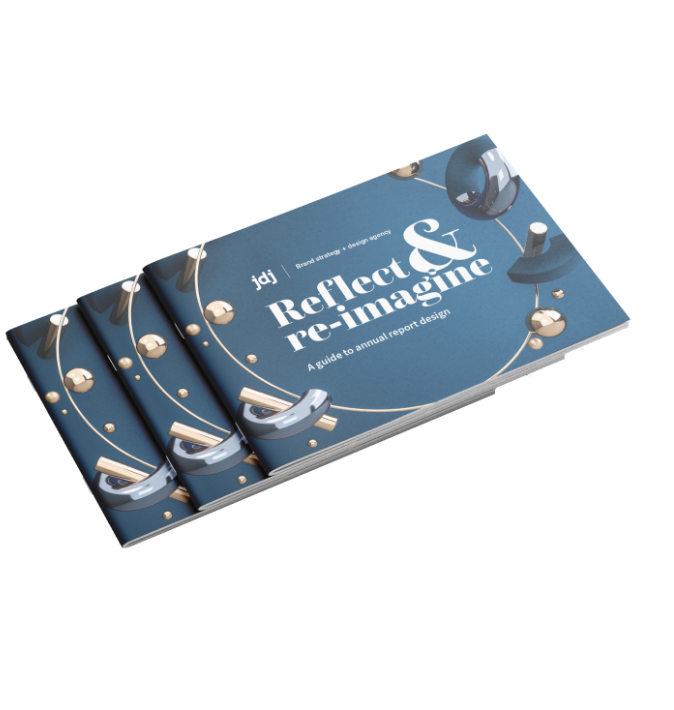
For financial organisations that are looking to produce great-looking reports and thought leadership content, our guides walk through the design process from planning and design to distribution and review.