The key points...
Automation is becoming more prevalent in graphic design
To avoid repetitive looking designs, a human input is still essential, creating unique data visualisation elements such as infographics and video
Working together, humans and AI can streamline the production process, without compromising quality
You don’t have to lose creativity in a digital world
Nowadays, seemingly everything is automated. Tasks that once took minutes when undertaken by humans can now be completed in seconds through advanced AI. Manufacturing tasks are now completed by robots, likewise picking stock in a distribution centre or checking out shopping in a supermarket.
In graphic design and other creative roles, automation is becoming more prevalent too. Templates, graphics and stock images can all be populated with minimal human input. This process is super-efficient, but it’s important we don’t become too over-reliant on machine. That we don’t lose that spark that makes us unique – creativity.
Use engaging layouts to enhance engagement
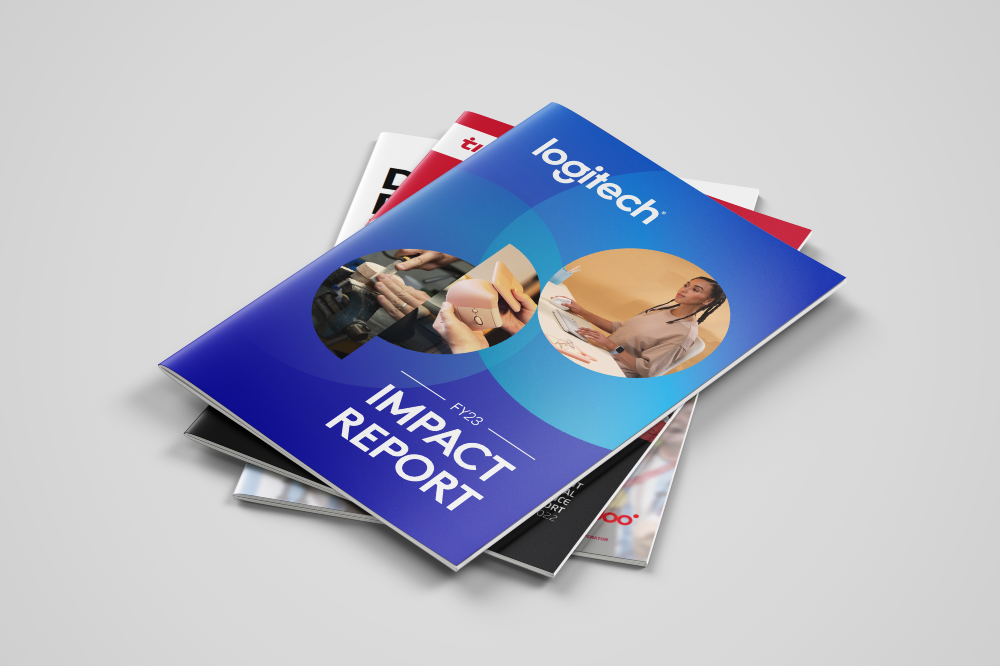
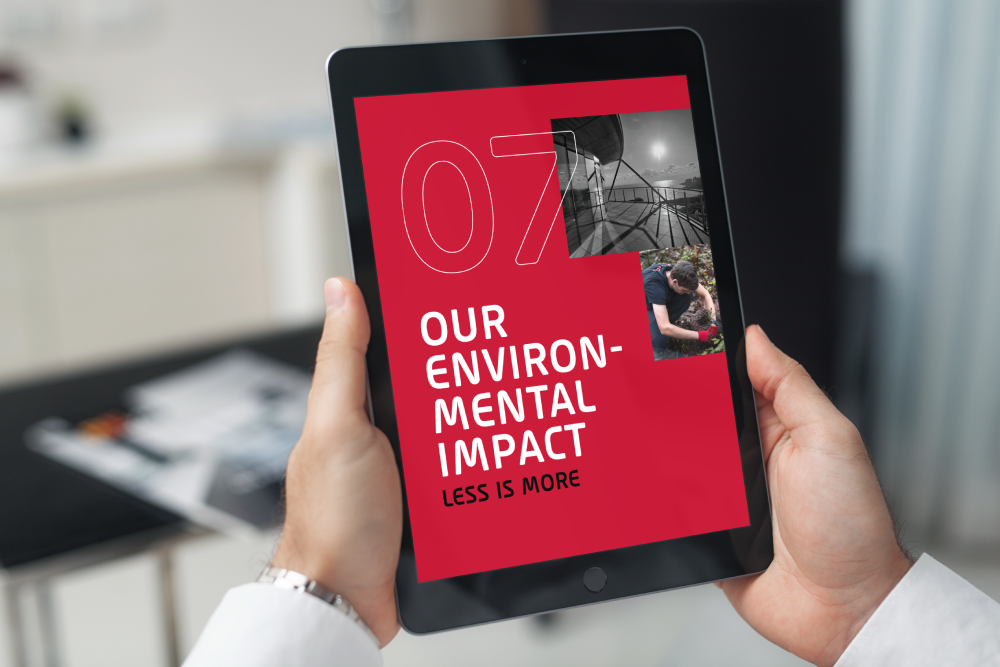
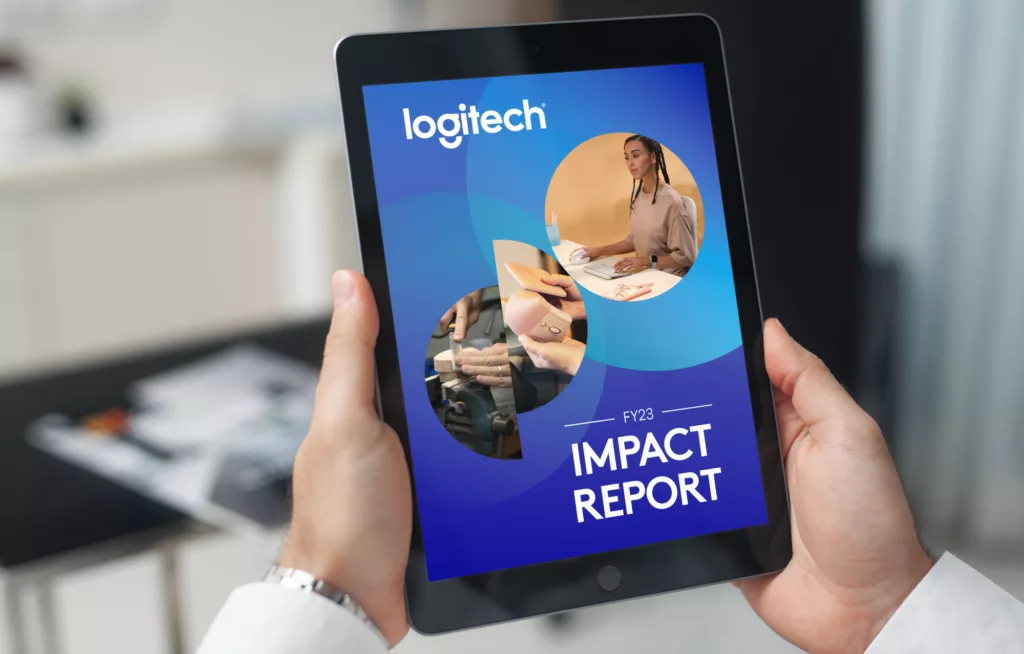
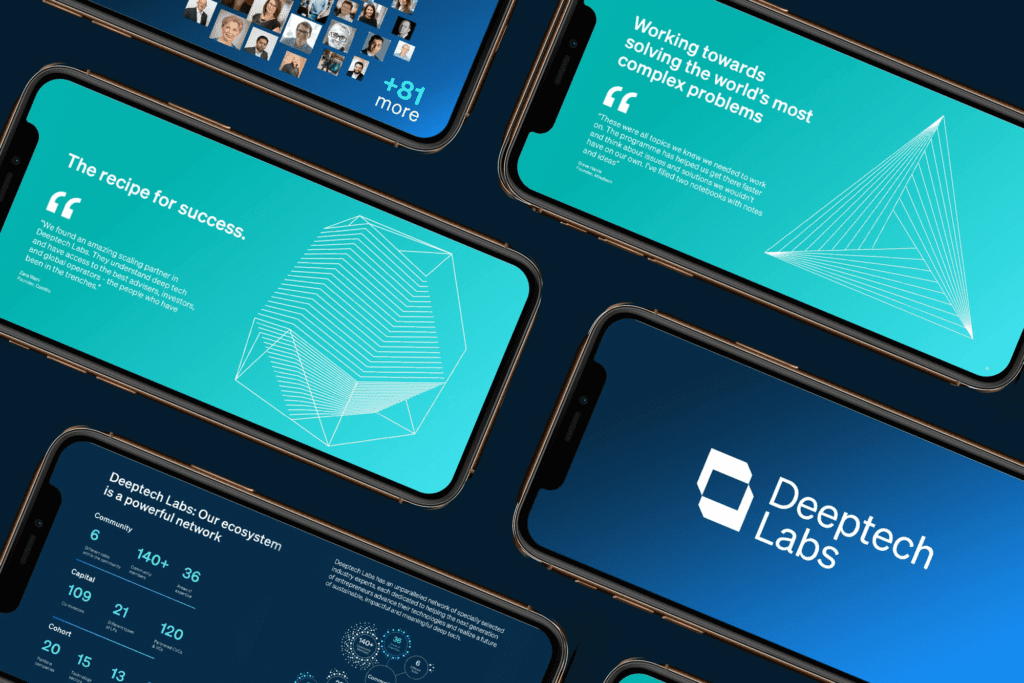
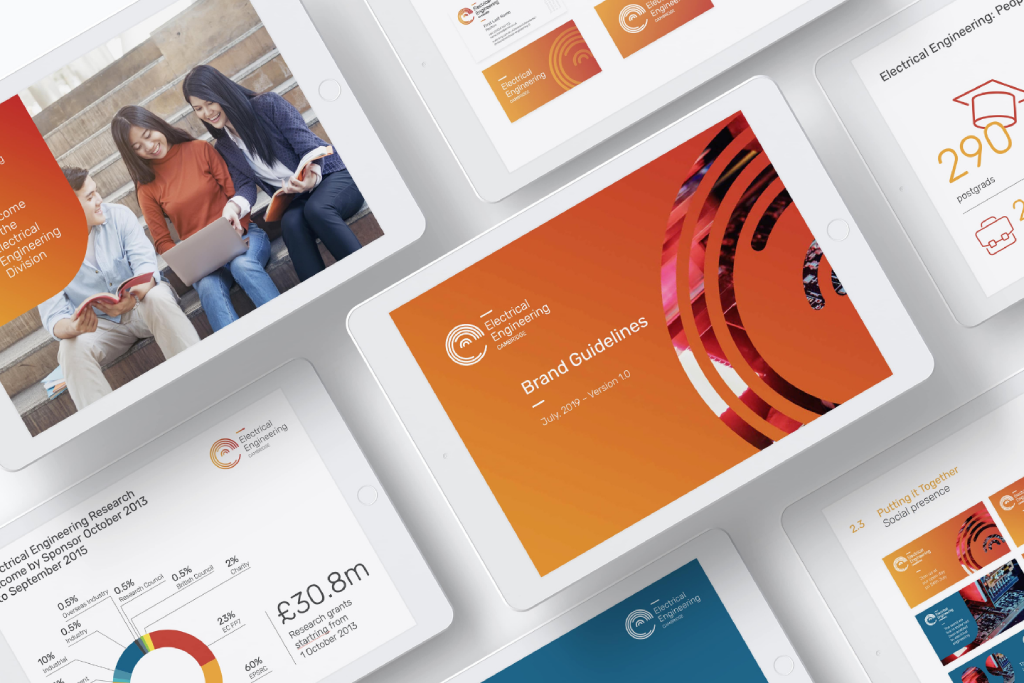
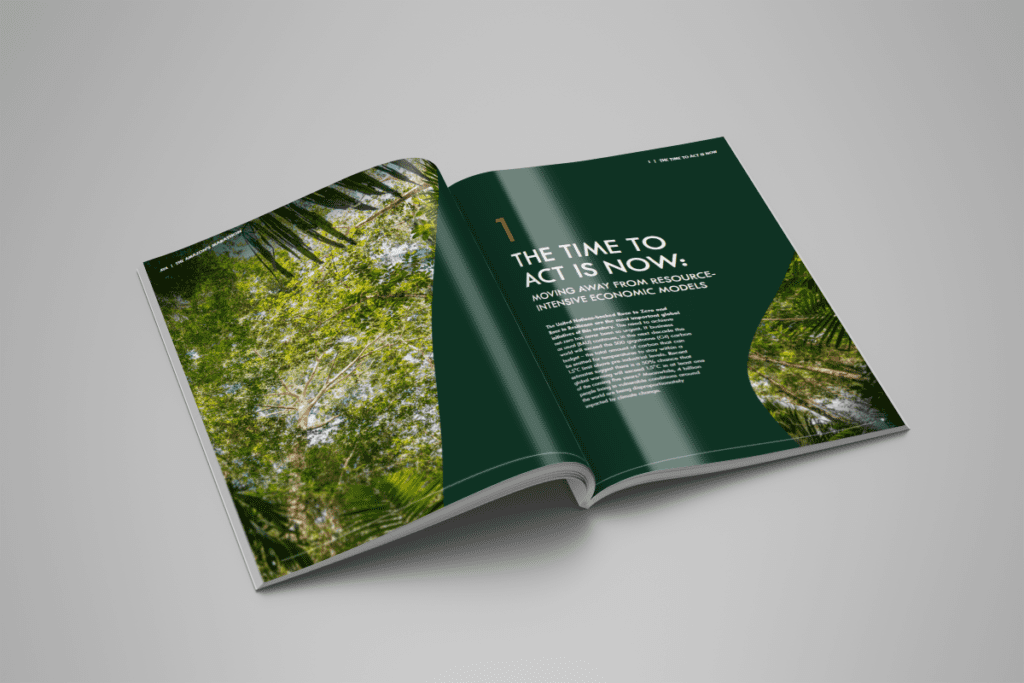
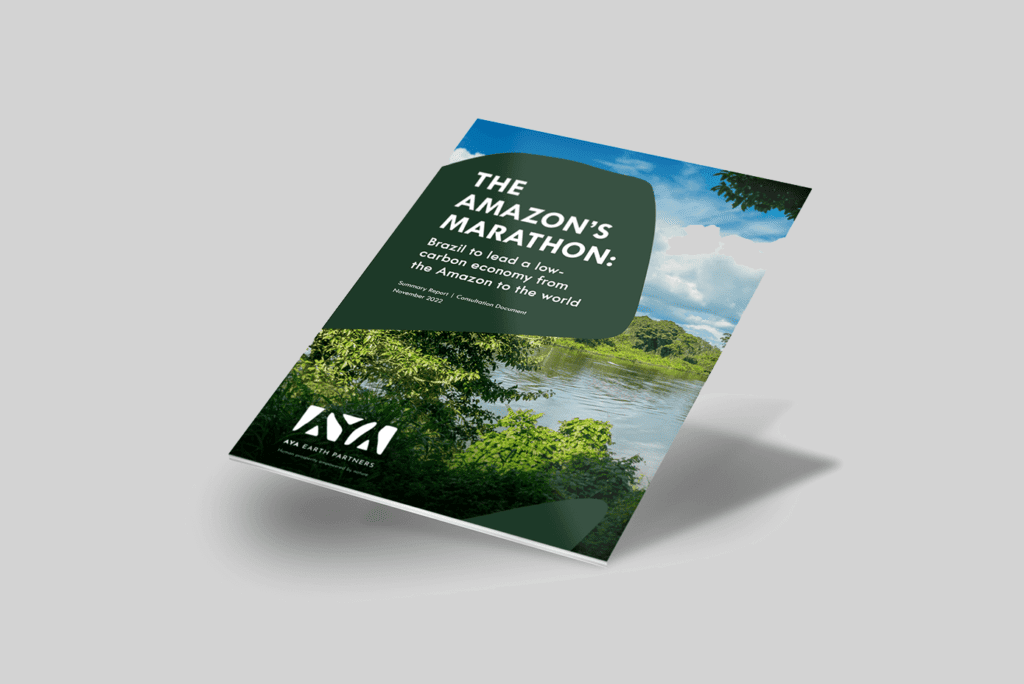
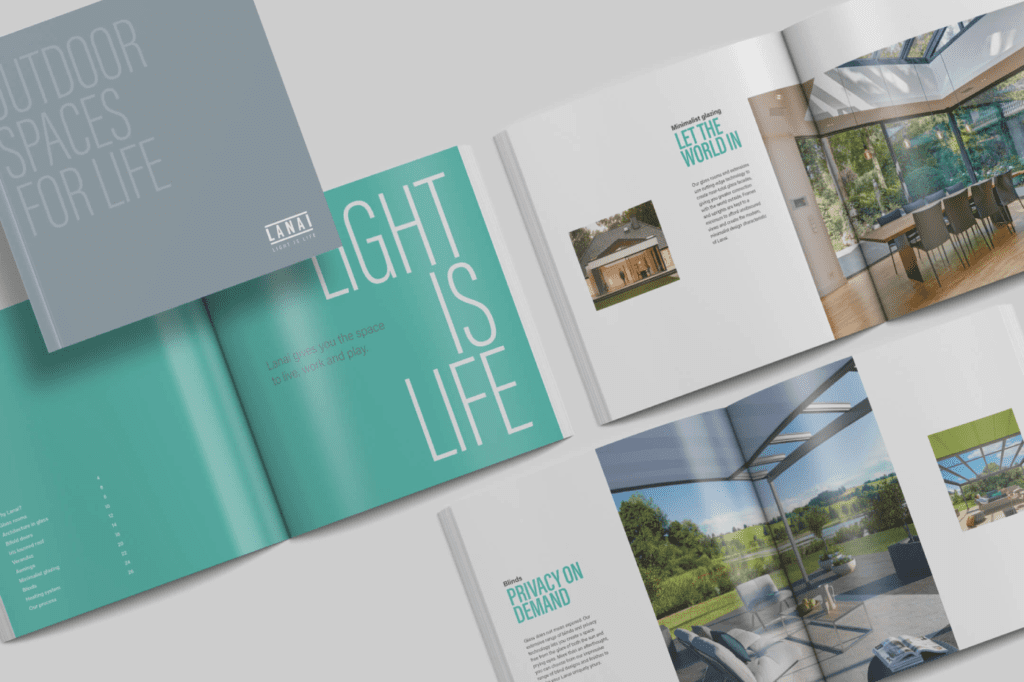
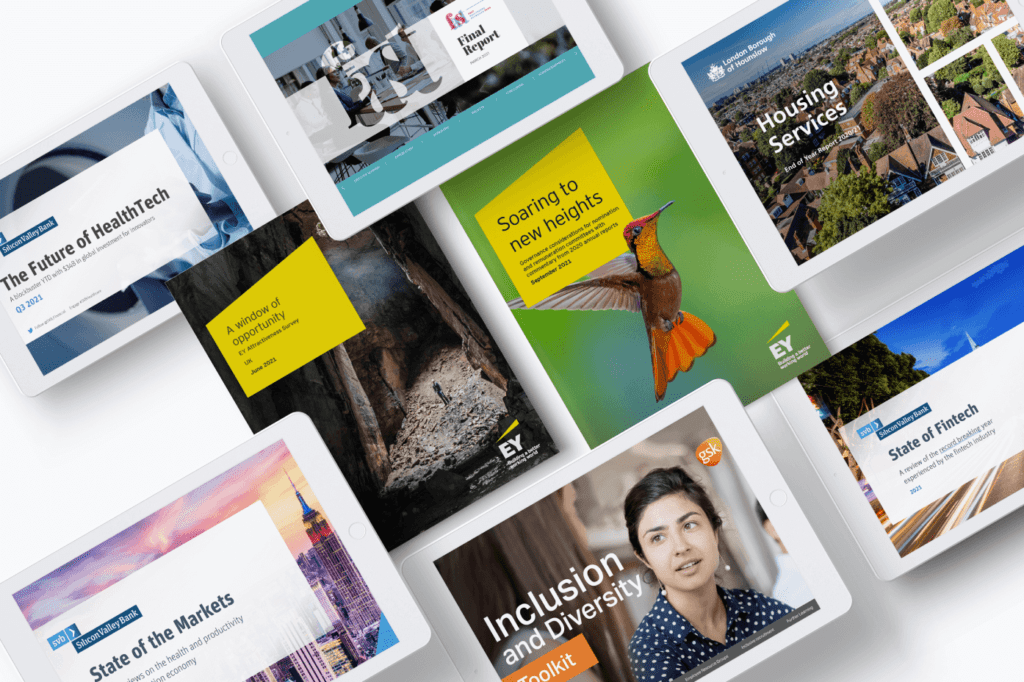
From the outset, let us say that many pre-designed templates look great. They’ve been created that way, to fit a purpose and a specific medium. The first few reports generated using them will look amazing. But what of the third or fourth. Or the fiftieth or the six-hundredth? Each document your company produces is unique, but limited templates and stock images can make your output look samey. Even worse, it may become indistinguishable from your competition.
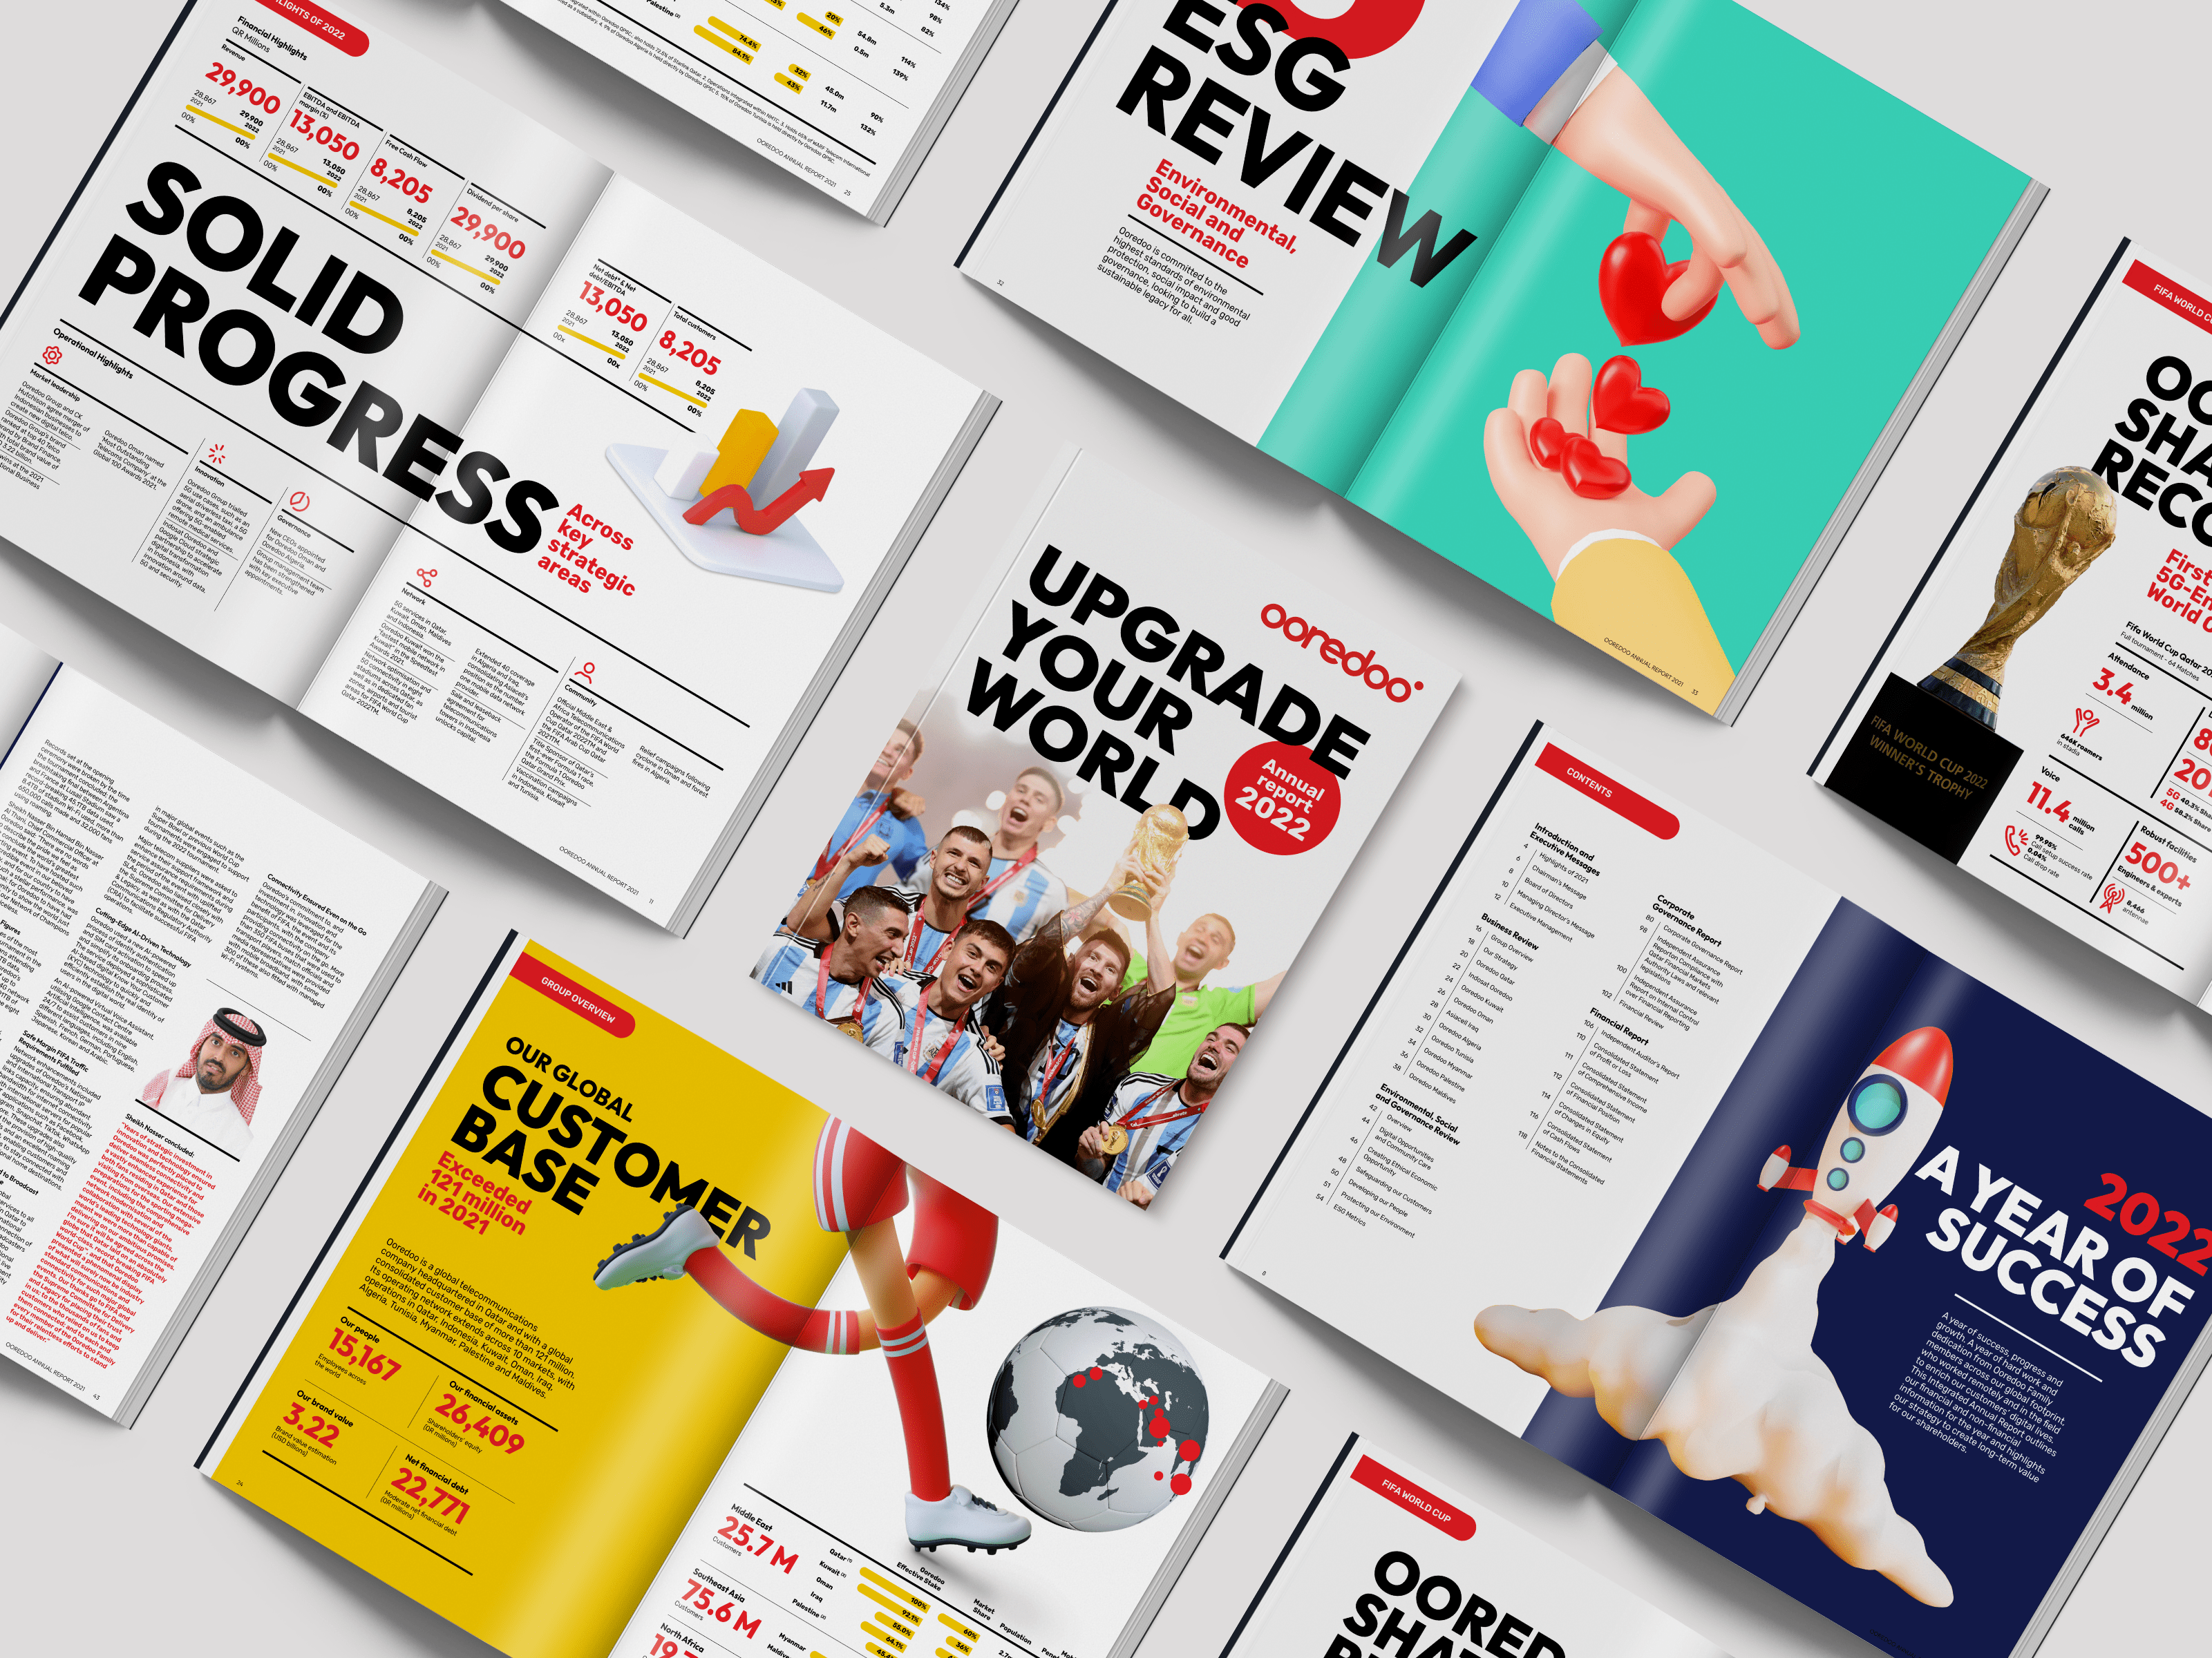
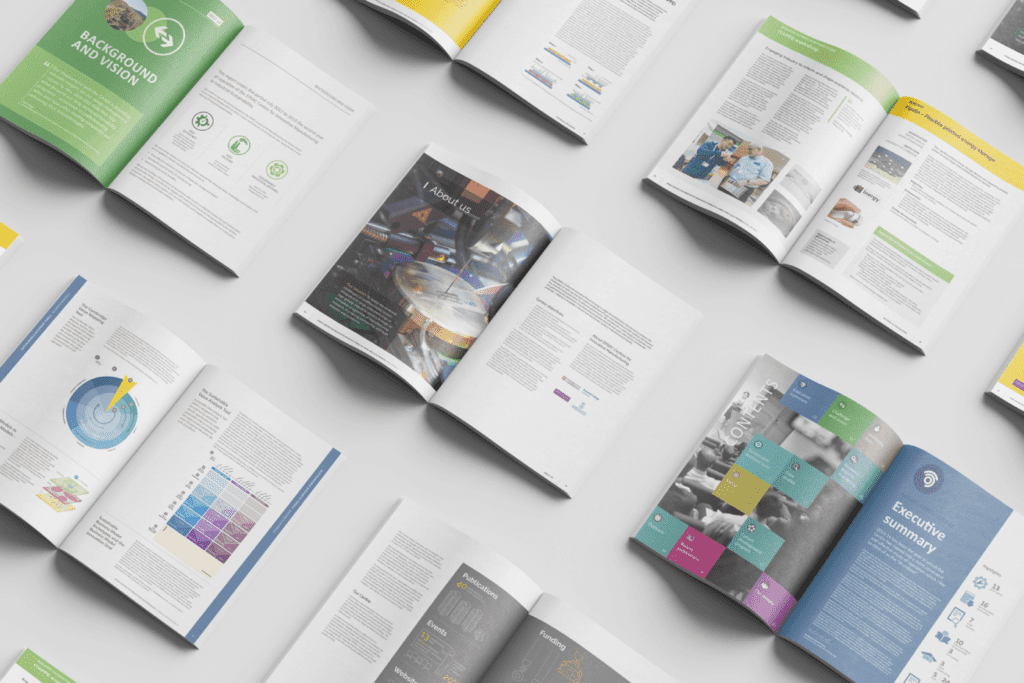
This is where engaging layouts are vitally important. They’re tailored to the individual document. Time’s taken to understand its specific audience, purpose and goals. That’s not to say part of the process shouldn’t be automated, but a human touch in the process can make all the difference.
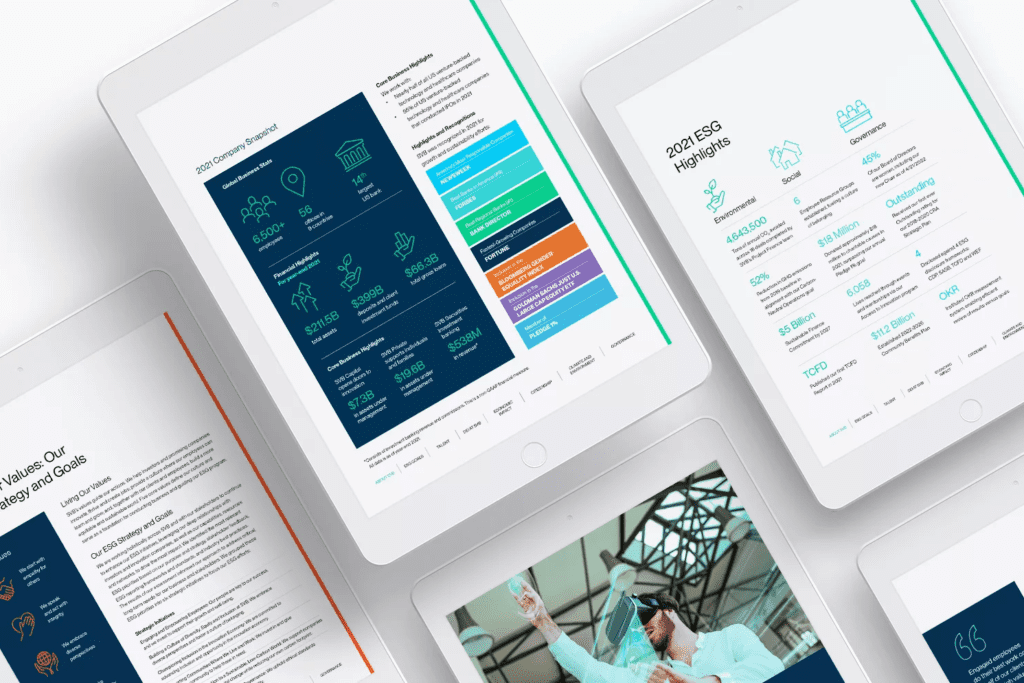
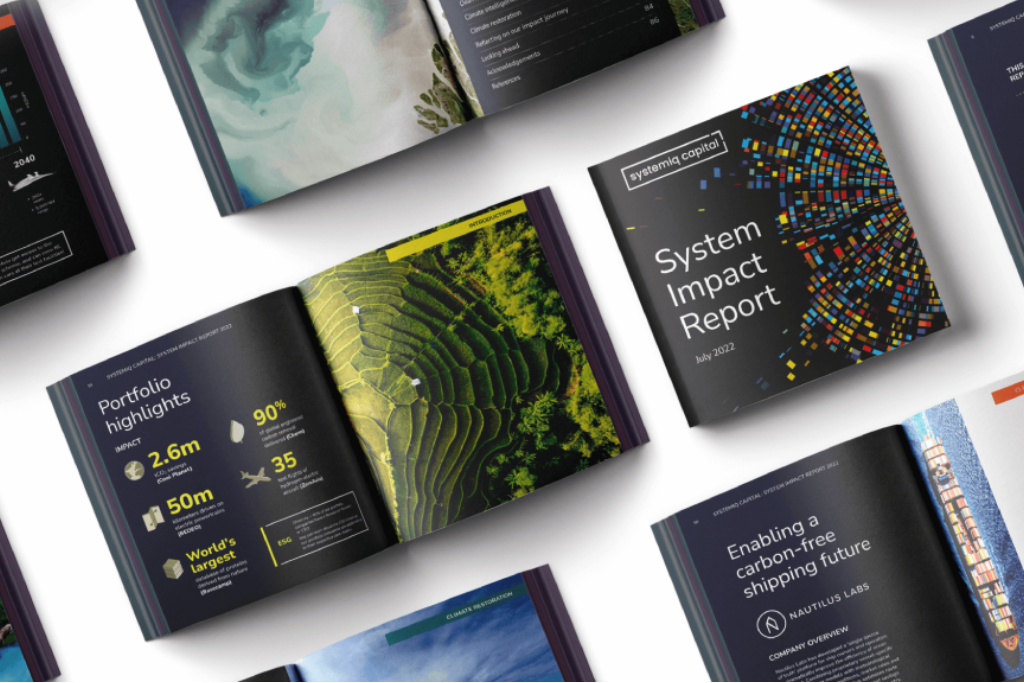
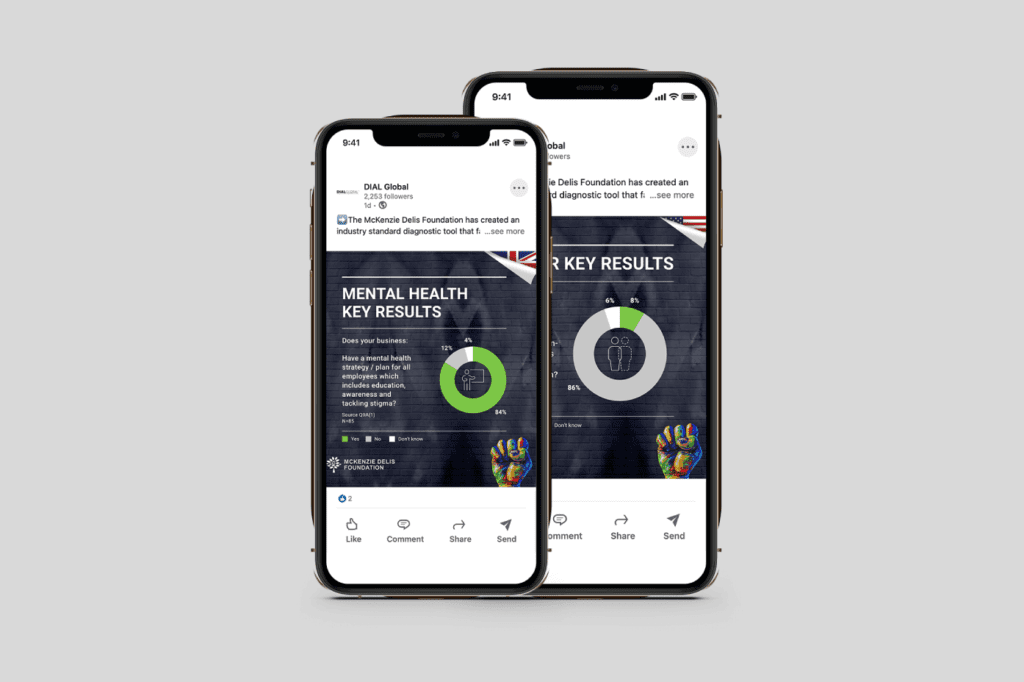
Video and infographics make content more engageable
As we’ve already said, one of the most important elements a graphic designer will want to know before starting any project is ‘who is the audience’. This will influence everything. The typeface choice, the colours, the imagery used, how it’s distributed…
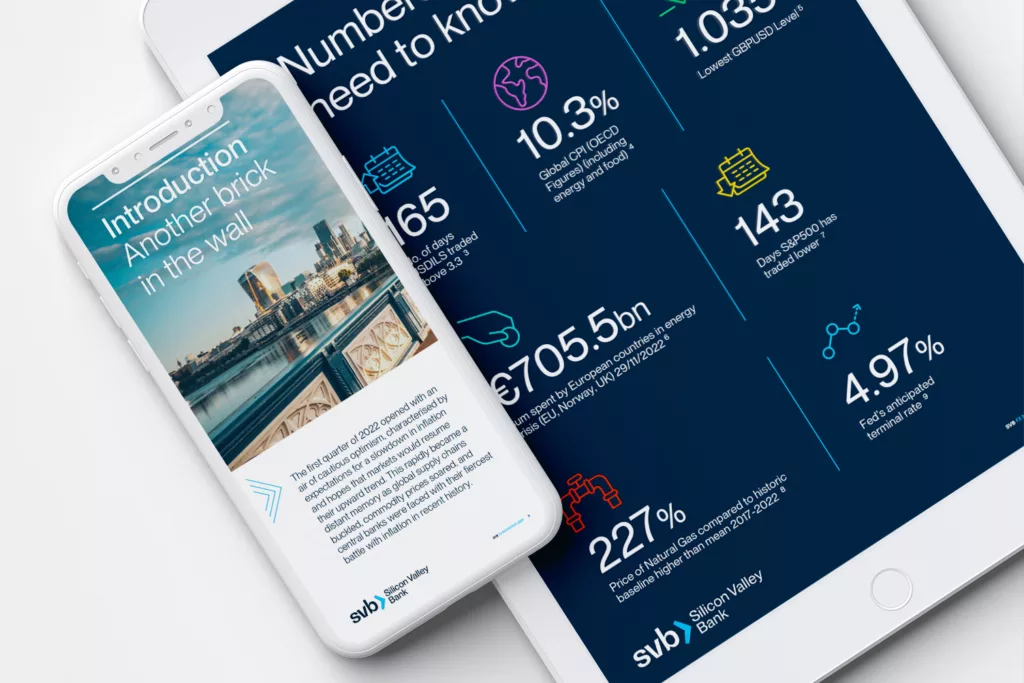
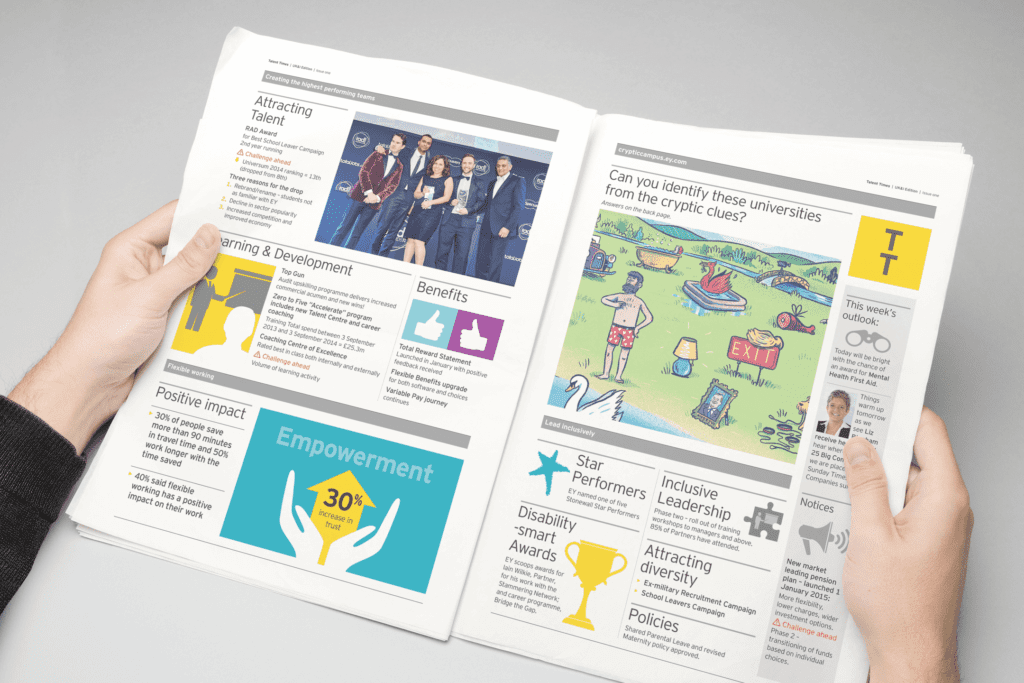
Some audiences will be able to immediately understand a graph and will be happily captivated by long passages of numerical data. Others will need more help. An infographic can disseminate information in an easy-to-digest way. A video can increase interaction. In order to reach the largest possible audience, it’s important to cater to everyone. By adding these creative or visual elements to an automated report, a document can be transformed.


