How to Distribute an Annual Report
Well, here we are. We’ve rounded the final bend and are on the home stretch. The printed reports have been posted, the digital version is available online. Everyone’s delighted with the finished result.
So, now what?
Once you have completed your annual report and distributed it to your key stakeholders, it can be all too easy to forget about it. To disregard it amongst a pile of statistics and financial data, lost until the reporting process recommences next year. But to do so means missing out on vital traction and wonderful marketing opportunities. It’s akin to preparing a three-course meal, only to serve the starter before skipping straight to coffee.
By effectively promoting your annual report, you can make it work for you all year round.
Promoting your annual report
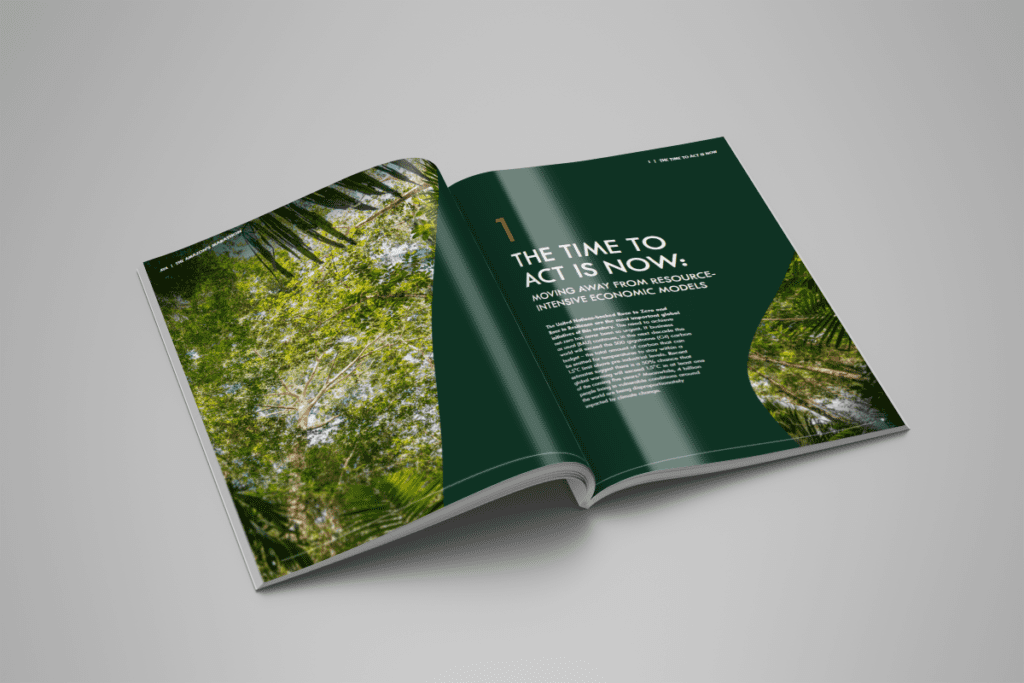
Yes, at its core, an annual report is a legal obligation. But we hope by now you’ve discovered that it’s more than that. It’s an investment pitch and a recruitment tool. It engenders trust in your brand and reaffirms your purpose. Given the time and effort that has gone into producing the document, it’s only right to give it the exposure it deserves.
By following these steps you can increase your chances of it being seen by the maximum number of people.
Engage your website visitors
Visitors to your website are expecting an experience that lives up to your brand. They are visiting your site because they have an interest in your product or service. Which means they may be interested in finding out more about you.Given the effects of coronavirus, we’ve already seen the importance placed on retaining existing customers throughout 2021. Your annual report can go a long way to cementing trust amongst your already engaged audience.Including a banner on your home page is an effective way of drawing attention to your report from the first touch point. This content will be valuable all year round and should be promoted prominently for three to four months after its release.
An annual report is a piece of content, companies should also link to the report at every opportunity. That means in blog posts, on your about us page, and even in dedicated download sections. The more opportunities users get to interact with your report, the more exposure it can bring.
Utilise the power of email
Your existing email lists are a source of contacts at all stages of the sales funnel. Some may not be invested in the release of your accounts, but others will be interested to discover your actions regarding purpose and company culture. Effective segmentation can enable distribution to your most likely engaged stakeholders.Consider adding your annual report to company email messages throughout the year. Promoted through well-designed graphics, a recurring email link can encourage recipients to click through and read.It’s not only corporate emails that can promote your report. Employees can insert simple hyperlinks to their email signatures, or even a clickable graphic, encouraging interaction through every email sent during the working day.
Maximise your internal communication channels
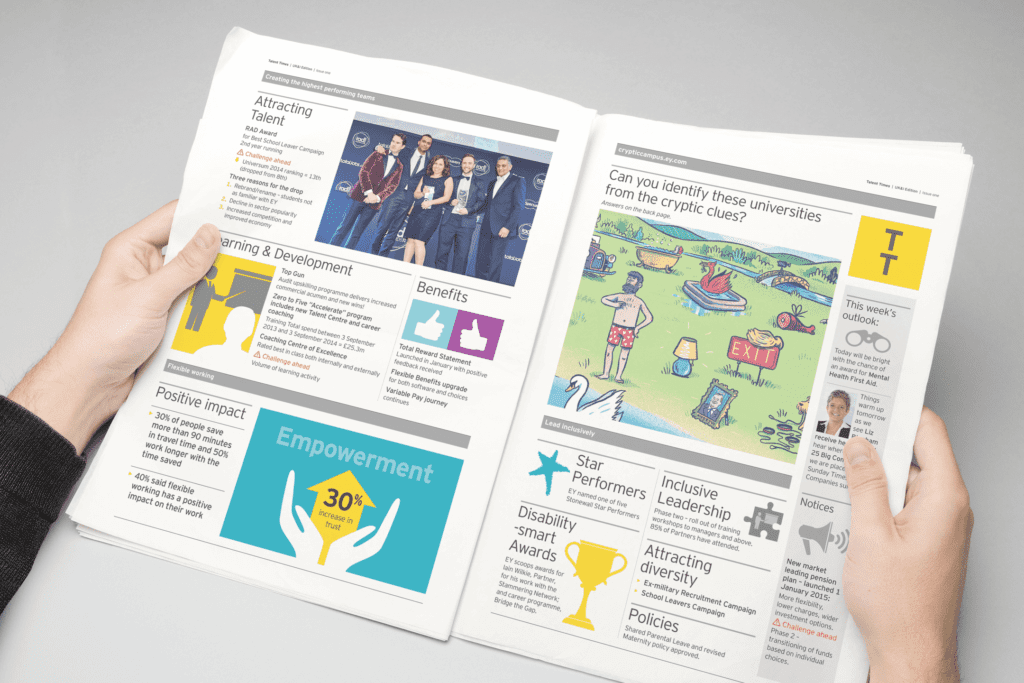
Often, your employees are your most engaged stakeholders, with your annual report a source of pride to many. By inspiring them through effective internal newsletters, or prominent positioning on the intranet, you can utilise your people as brand ambassadors, sharing the report on their social media channels or emailing to professional connections. This social proof of your claims will increase trust in your words.
Repurpose content for social media
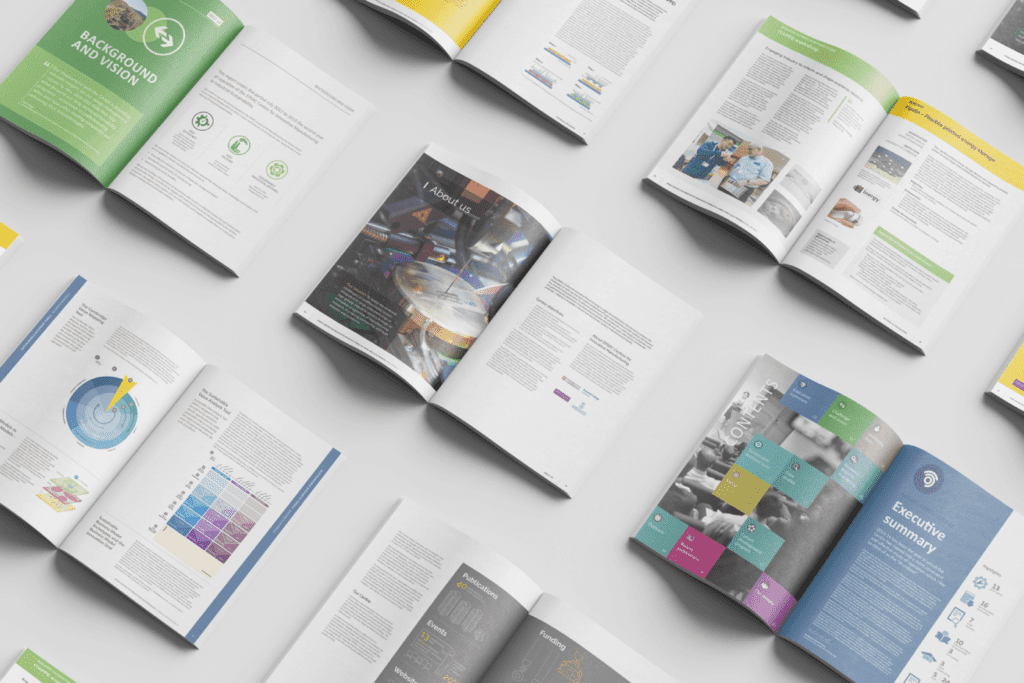
A lot of time goes into the design of an annual report. Too much to only release it in its original form. Conveniently, an annual report lends itself beautifully to re-purposing. Re-using this large piece of content in the following ways is an economical method of content creation.
Data as engaging visuals
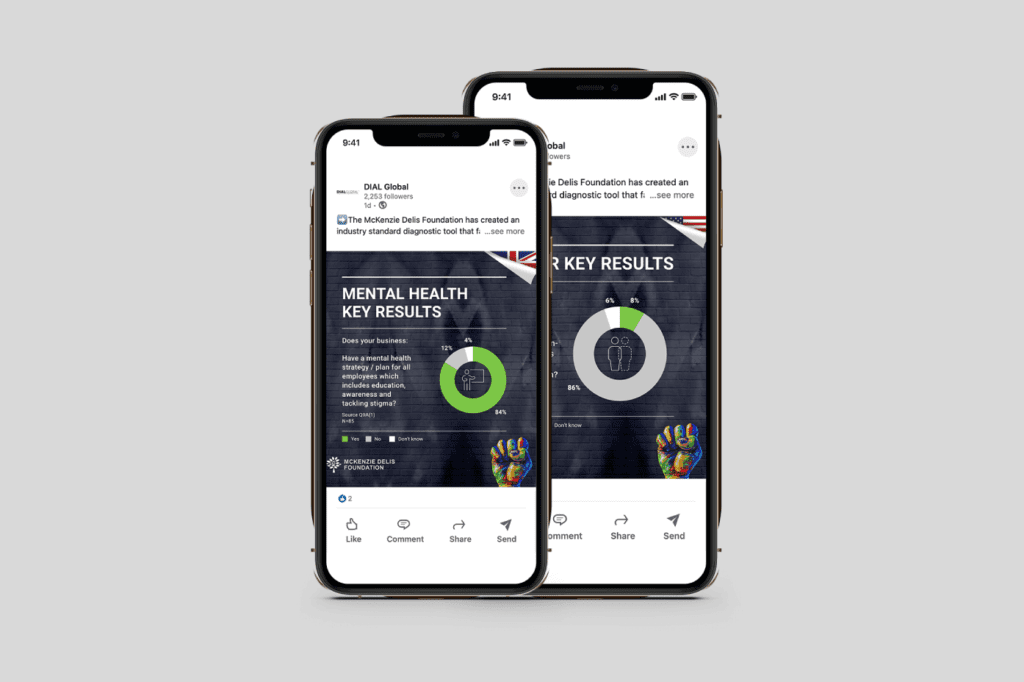
There are a multitude of charts, graphs, and statistics that can create highly visual social media posts. A graphic highlighting an important figure or set of data can become an Instagram or Facebook post. You can turn statistics in text form into sharable Twitter posts. Quotes and other key takeaways are also sharable across all social channels. All generate engagement and useful links back to your original content, spreading your message exponentially.
Short Video Content
Your annual report should tell a story. Video content is engaging and memorable. It represents an opportunity for key board members to interact directly with stakeholders – to put a face to the organisation. This could be a message from the CEO reflecting on the previous 12-months or providing forecasts for the upcoming year. It may be an interview with the CFO or a brief message from the company Chair introducing the report.We digest most video content on mobile devices, which are on mute by default. Adding subtitles or text led videos are ways to ensure followers do not miss your message.
GIFs
Like videos, GIFs are effective on social media platforms because they create eye-catching movement in news feeds. This animation could showcase key takeaways. Make sure to keep the style uniform across the report and all social posts to increase cohesion.
Measurement and metrics
Having undertaken the hard work of promoting your report through various channels, one of the most important steps is measuring the success of the campaign. For online reports, this is a relatively simple task. Google Analytics (or your own reporting tools) make it easy to measure behavioural metrics such as the number of page views, the length of time people spent on a page and how many people clicked to download the report.
Likewise, social media reporting can show the number of views a post about your report received, as well as other interactions, such as likes, comments and shares. While these metrics do not show an emotional response to the information contained within the document, they do offer a good insight into the amount of interest surrounding the report.
For printed offerings, understanding how somebody interacted with your report is more difficult. One way to measure interactions is to include a custom URL which is only included in the printed copy. An effective solution if the report links to a location online, such as to watch a video, for example. When page views of this URL are shown in your analytics, it can be assumed that they have come from somebody reading the printed report itself.
Finally, ask people what they thought about the report. Listen to comments on social media, how it is received by news outlets and other websites, or create a formal survey to get an overview of public opinion. This insight can be vital when creating next year’s report.


